Buzz Haven: Your Daily Dose of News
Stay informed and entertained with the latest buzz in news, trends, and insights.
Decoding Google Analytics: What Your Data Is Trying to Tell You
Unlock the secrets of your data! Discover what Google Analytics is really telling you and boost your website's success today!
Understanding Key Metrics: What Do They Mean in Google Analytics?
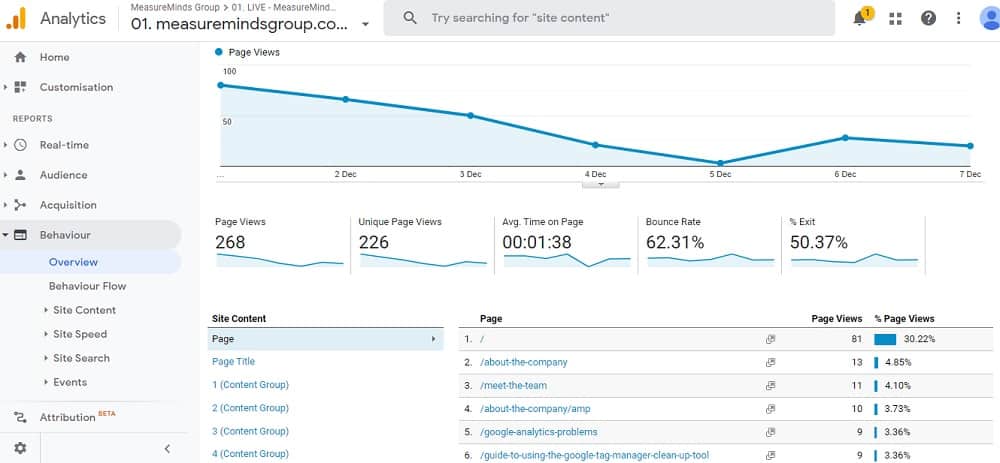
Understanding key metrics in Google Analytics is essential for anyone looking to improve their website's performance. Sessions represent the total number of visits to your site, while Users indicates the number of unique visitors. Analyzing these metrics helps you determine the effectiveness of your traffic sources and user engagement. Additionally, the Bounce Rate, which measures the percentage of visitors who leave your site after viewing only one page, can provide insight into the relevancy and attractiveness of your content.
Another crucial metric is Average Session Duration, which tells you how long users stay on your site during their visit. A longer duration often signifies that visitors find your content valuable and engaging. Furthermore, Conversion Rate is a vital indicator of how well your site meets its goals, whether that's generating leads, sales, or newsletter sign-ups. By understanding these key metrics and analyzing them regularly, you can make informed decisions to enhance your site's performance and user experience.

Common Mistakes in Interpreting Google Analytics Data
When analyzing Google Analytics data, one of the common mistakes is misinterpreting user behavior metrics. For instance, many people tend to equate a high number of page views with successful content; however, this does not necessarily indicate that visitors are engaging meaningfully with the material. A better approach is to focus on metrics like average session duration and bounce rate, which provide deeper insights into user engagement. Relying solely on page views can lead to misleading conclusions and ineffective strategies.
Another frequent error is ignoring the context of the data. Marketers often fail to consider external factors such as seasonality, marketing campaigns, or even changes in the website's design. For example, a sudden drop in traffic might be alarming, but it could coincide with a major holiday when users have different online behaviors. It's essential to analyze data trends over time and correlate them with any outside influences. Doing so will enable a more comprehensive understanding of the website's performance and user engagement.
How to Use Google Analytics to Improve Your Website's Performance
Understanding user behavior on your website is crucial for enhancing its performance. Google Analytics provides valuable insights into how visitors interact with your site. To begin, set up your account and integrate it with your website by adding the tracking code. Once that is done, familiarize yourself with the dashboard. Key metrics to monitor include session duration, bounce rate, and traffic sources. Analyzing these metrics will help you identify where users are engaging and where they drop off, allowing you to make data-driven decisions to improve performance.
Once you have your data, use Google Analytics reporting tools to create customized reports that highlight user trends and patterns. Focus on identifying high-traffic pages by utilizing the Behavior Flow feature, which illustrates the paths users take through your site. If certain pages show high bounce rates, consider optimizing the content or layout to enhance user engagement. Additionally, you can set up Goals to measure conversions and track specific user actions such as sign-ups or purchases. By continually refining your strategy based on these insights, you can significantly improve your website's overall performance.