Buzz Haven: Your Source for Trending Insights
Stay updated with the latest buzz in news, trends, and lifestyle.
When Data Meets Design: Transforming Insights into Visual Stories
Discover how to turn raw data into captivating visual stories that engage and inspire—unlock the power of design-driven insights!
How to Effectively Visualize Data: Tips and Techniques
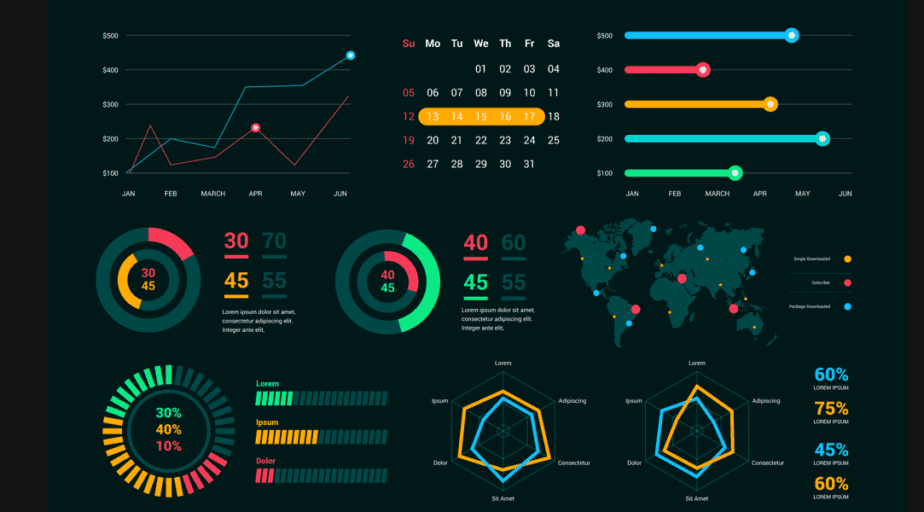
Visualizing data effectively is crucial for conveying insights clearly and efficiently. One of the first steps in data visualization is choosing the appropriate type of chart or graph based on the nature of your data. For example, if you're dealing with categorical data, bar charts can provide a clear comparison, while line graphs are great for showing trends over time. Additionally, it's essential to keep your visuals simple and uncluttered. Avoid unnecessary embellishments that can distract from the core message. Remember, the goal is to make the data accessible and understandable for your audience.
In addition to selecting the right format, consider incorporating color effectively in your data visualization efforts. Use contrasting colors to highlight key data points or categories, but be mindful of color-blind accessibility by avoiding combinations like red and green. Another useful technique is to apply data storytelling principles; narrating the story behind the data can help your audience engage more deeply with the information presented. Finally, always test your visualizations on diverse audiences to ensure clarity and impact — remember that feedback is vital for continuous improvement.

The Importance of Storytelling in Data Visualization
In today's digital age, the ability to convey complex information effectively is crucial. Storytelling in data visualization transforms raw data into engaging narratives that resonate with audiences. By integrating compelling visuals with a structured narrative, data storytellers can lead their viewers on a journey, making it easier for them to grasp the significance of the data presented. This approach not only enhances retention but also promotes better understanding of insights that might be lost in a sea of numbers.
Effective data visualization goes beyond mere aesthetics; it involves crafting a coherent story that highlights key patterns and trends. Utilizing techniques such as charts, infographics, and interactive dashboards can guide the viewer's focus and evoke emotional responses. As a result, storytelling becomes an essential tool for marketers, educators, and analysts alike, helping them communicate their messages more powerfully and persuasively to drive action and decision-making.
Transforming Raw Data into Compelling Visual Narratives
In today's data-driven world, transforming raw data into compelling visual narratives is essential for effective communication. Organizations increasingly rely on data visualization to tell their stories, highlight trends, and simplify complex information. Through the use of tools such as charts, graphs, and infographics, raw data can be distilled into easily digestible formats that engage audiences. This process not only enhances understanding but also fosters a deeper emotional connection, as visual representation often resonates more with viewers than spreadsheets full of numbers.
To achieve this transformation, it is crucial to follow a systematic approach. First, identify the core message you wish to convey and select the most relevant data to support it. Next, choose the right visualization technique, whether it's a bar chart for comparisons, a line graph for trends over time, or an interactive dashboard for dynamic insights. Finally, ensure that your visuals are not only aesthetically pleasing but also intuitive, utilizing colors and layouts that enhance readability. By focusing on these key elements, you can effectively turn raw data into visual narratives that inform, engage, and inspire your audience.