Buzz Haven: Your Source for Trending Insights
Stay updated with the latest buzz in news, trends, and lifestyle.
Charting Your Way to Insight
Unlock the power of data! Discover how to turn charts into actionable insights and elevate your decision-making skills today.
Understanding Data Visualization: A Guide to Effective Charting
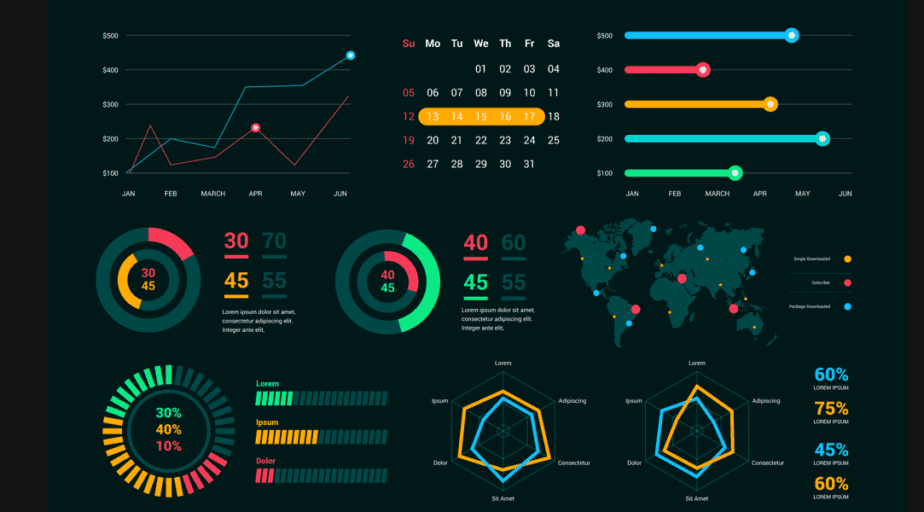
Understanding data visualization is essential for communicating complex information clearly and concisely. Effective charting allows audiences to grasp trends, patterns, and insights at a glance. When creating visual content, it is crucial to choose the right type of chart that fits the data being presented. For instance, bar charts are excellent for comparing categories, while line graphs are better suited for showing changes over time. Additionally, consider using color and design strategically to enhance readability and focus attention on key elements.
To achieve impactful data visualization, it is important to follow some fundamental principles. First, always aim for clarity by avoiding unnecessary embellishments that can distract from the message. Consistency in the use of fonts, colors, and chart types makes the visual easier to understand. Additionally, labeling axes and providing legends give context to your visuals, helping viewers interpret data correctly. Lastly, testing your visuals with real users can provide valuable feedback, ensuring that the chart effectively communicates the intended information.

Top 5 Chart Types for Transforming Data into Insight
In today's data-driven world, effectively transforming data into insights is crucial for making informed decisions. One of the best ways to achieve this is through the use of visual representations. The top 5 chart types below are essential tools for distilling complex information into clear, actionable insights:
- Bar Chart: Ideal for comparing quantities across different categories, bar charts provide a straightforward way to visualize data relationships.
- Line Chart: Perfect for showing trends over time, line charts enable users to quickly identify patterns in large datasets.
- Pie Chart: Useful for displaying proportions, pie charts help illustrate how different segments contribute to a whole.
- Scatter Plot: Great for exploring the correlation between two variables, scatter plots can reveal relationships that might not be immediately evident.
- Heat Map: Effective in displaying data density or volume, heat maps allow viewers to quickly grasp areas of concentration within the data.
How to Interpret Charts: Tips for Making Data-Driven Decisions
Interpreting charts effectively is crucial for making data-driven decisions. To start, familiarize yourself with the types of charts you encounter, such as bar graphs, line charts, and pie charts. Each type serves a different purpose and can convey distinct messages. For instance, bar graphs are excellent for comparing quantities across categories, while line charts are ideal for showing trends over time. Always pay attention to the axes and labels; they provide the necessary context to understand the data being presented.
Next, consider the source of your data and its credibility. Reliable data enhances your ability to make informed decisions. While interpreting the chart, look for patterns or anomalies that stand out. For better clarity, you might want to visualize the data with additional tools or even recreate the charts yourself. Also, remember to ask questions like: What does this data indicate? How does it affect my current strategy? By following these tips, you can enhance your chart interpretation skills and leverage the data for more effective decision-making.